
In my post from last month, I am sharing my experience from rebuilding my WordPress website using a block theme, including a performance comparison. As part of that post, I included a spreadsheet with a detailed performance breakdown from before and after the changes. I only provided a bit of context for how I conducted the performance comparison in that post, however as promised, in this post I am sharing the concrete methodology that I used and how you can use it to measure performance of websites yourself.
In order to better explain the methodology, I thought I might just do another similar kind of analysis that I would go over in this post. Last week, WordPress 6.2 was released, so no better opportunity than to measure how updating my website from WordPress 6.1 to 6.2 affects its performance!
I created a spreadsheet with the full data for this new analysis, and in this post we’ll go over the process for how I got that data in detail.
Planning the performance analysis
Before measuring web performance for any purpose, we need to think about what is our goal with the performance analysis, and based on that define a rough plan for it. Likely the most common approach is to use a tool like Lighthouse, PageSpeed Insights, or WebPageTest on the home page of your website. However, when you do that, keep in mind that all you’re measuring is the performance of your home page, not your entire website. Since the home page often has a vastly different structure from other content on your website (e.g. individual posts), it may not even be close to representative of your site’s overall performance. How you go about it also needs to depend on your site’s audience. For example, if many of your site’s visitors come through search engines and social media, they may never see your home page and rather land directly on a specific post URL.
Focusing on comparison
I would like to emphasize that measuring performance usually means comparing performance, between two or more changes. Measuring performance, especially load time performance, will not give you a single consistent reliable value. Chances are if you conduct the same analysis that I’m doing in this post, you will get different numbers. It can be influenced by your network connection, how far away you are from the hosting server, how busy your machine is with other tasks, and more.
Of course if you have never tested performance of your site, there can be value in doing a single analysis just to get an idea of where your site is at in terms of performance. However, what I would usually suggest is to focus on comparing performance between two or more distinct changes.
For example, in my previous post I wanted to assess how migrating my site to using a WordPress block theme impacts its performance. So I first measured my site’s performance in its original state, then deployed all the updates to switch to the block theme, and then measured the site’s performance again. That gave me two sets of performance data that I could compare. I then implemented another set of smaller performance iterations on my website, and then measured its performance again. In other words, overall I had three different data sets to compare. What is extremely important with those comparisons is that you measure the data in precisely the same way. Use the same test scenarios, the same metrics, the same tooling. We’ll go over that below.
Choosing test scenarios
One of the most important things for planning your performance analysis is to define test scenarios you would like to measure. This can take the form of a list of URLs with content of different kinds (e.g. the home page, an archive of posts, an individual post, an individual product page, just to name some examples), or depending on your use-case you may need to do something more specific: For example, if you just made a change to your website that is expected to improve load time performance of content with lots of comments, you should probably include a URL with lots of comments as one of the test scenarios.
Keep in mind that the more test scenarios you consider, the more effort the analysis will take, so you also want to make sure not to go overboard.
In my case, in my previous post I did nothing more than testing the home page – which admittedly is a very limited approach. But all I wanted was to get a general impression on how the migration of my site to a block theme influences performance, and the home page alone already gave me that. I could have included other kinds of content for a broader picture (e.g. a single post URL), but in the last analysis I kept my scenarios to a minimum – partly also because I knew I would want to make further enhancements and then have a third comparison of the same scenarios, so I didn’t want to make it too much work for me.
For the purpose of this post, all I’m curious about is how load time performance in general is being influenced by the update from WordPress 6.1 to WordPress 6.2. Let me share a bit of context for what I am specifically looking for:
- While WordPress 6.2 has notably improved its server response time, my website uses a full page cache, which means I’ll likely see less of that since my site’s server response will typically bypass most of the WordPress core logic altogether. There may still be some influence by the changes that I can see on my site, but I don’t anticipate a major win in Time to First Byte (TTFB) for my specific site for that reason.
- Another notable performance win in WordPress 6.2 is that lazy-loading, or more specifically not lazy-loading the LCP image, is finally working in block themes. Towards the end of my previous post, I already mentioned that and in fact implemented a workaround for the lack of that on my home page, since at the time of that post, my site was still using WordPress 6.1. However, that fix was specific to my home page, it didn’t address the problem in other parts of my site. So while I don’t expect major improvements from this on my home page, I do expect major improvements on other content, such as individual posts.
To cover both of the above, for this analysis I would like to measure performance of the home page and a single post – the latter primarily to get data about the second point above. I’ll use the URL to my previous post for this. To summarize, this means I will compare performance for the following two scenarios:
- The home page
https://felix-arntz.me/ - My previous post
https://felix-arntz.me/blog/rebuilding-my-website-using-a-block-theme/
Choosing relevant metrics
The other important aspect of planning a performance analysis is choosing the metrics you would like to gather to eventually compare. While common performance metrics like Web Vitals may come to mind, metrics can take many shapes and forms – consider anything that can be expressed in a number as a potential metric. Which metrics you choose very much depends on what you want to focus on in your performance analysis. A few ideas as potential inspiration, other than Web Vitals:
- Number of image bytes received (or bytes from any specific kind of resource)
- Number of DOM elements (“DOM size”)
- I used this as one metric in the analysis from my previous post.
- Number of DOM elements that use a certain attribute (or even more granularly, a certain attribute with a certain value)
- Performance metrics exposed by the server (e.g. via Server-Timing header)
- Simple arithmetic combinations of multiple metrics (e.g. “time that the LCP image starts loading” minus “Time to First Byte”, also called “resource load delay”)
For both the analysis in my previous post as well as this one I am mostly interested in load time performance. The most obvious metric to consider for that is Largest Contentful Paint (LCP), and then also First Contentful Paint (FCP) and Time to First Byte (TTFB), both of which are technically encompassed by LCP and thus directly contribute to it.
As part of load time performance, I would like to assess server-side performance and client-side performance separately. LCP describes the time “when the page’s main content has likely loaded”, in other words it encompasses both – which makes it the best single metric to look at for overall performance, but on the flipside it is not exactly granular. TTFB is effectively the time the server takes to respond, so that metric can be used directly to assess server-side performance. In order to assess client-side performance, the logical conclusion is that I can use “LCP minus TTFB”. I don’t think a dedicated metric exists for this number, but I have personally found this combination of the two metrics quite useful, especially when you would like to assess performance of a change that you know only can affect client-side performance.
Last but not least, I am also going to collect the number of total bytes received. This is not as important as the other metrics, though I’m curious to see whether anything notable changed in that regard in WordPress 6.2. Mostly as a sanity check, since in case it sends notably more data for every request, it may be a potential issue to review more closely.
To summarize, for my performance comparison between my site using WordPress 6.1 and WordPress 6.2, I will go with the following metrics:
- LCP
- FCP
- TTFB
- LCP – TTFB
- Total Bytes
You can see those metrics all over the spreadsheet for the analysis as well.
Conducting the analysis
Now that we have defined the comparison, scenarios, and metrics for our performance analysis, we can start gathering the data. Before doing that, I have already prepared the updates to my site locally and also in my site’s staging environment, so that they are ready to deploy to my live site as soon as I hit the button. This way, I can gather the data for the analysis pretty much in one go, without first having to collect data before the change, then having to pause that to actually implement the change, and only then collecting the data after the change. It’s always a good practice to collect all data sets for your comparison not too far apart from each other, to decrease the chance that external factors may skew the data from one data set to the next.
It’s not as simple as running one test
A common misconception around measuring performance is that you can use a tool like Lighthouse, PageSpeed Insights, or WebPageTest to load your test URL once and be done with it. Depending on which metrics you are interested in, this may work, but if you are looking at any timing based metrics, you will need to use multiple requests or runs to your test URL. The reason for that is that, unfortunately, timing based metrics vary. There is no single universal value for metrics like LCP, FCP, or TTFB. They heavily vary between different environments, for example using a desktop with fast cable connection will probably get you faster load times than a phone on a 4G network. But even on one specific device, times will vary: For example, the website host may “randomly” respond faster or slower to your request, or even your own machine may have other processes running that affect its CPU usage, making the request faster or slower.
All of that is to summarize that you should always use several requests per test URL, and you can then calculate the median or more granular percentile values based on all requests as a single value for each metric. To make a simple example: Let’s say I make 5 requests to my home page and LCP in each of them is 1.2s, 1.1s, 1.5s, 1.1s, 1.3s. Then the median LCP is 1.2s, and that is what I can use as a result.
In reality, even 5 requests may not be enough to account for the variance in a metric, but it all depends on what you are comparing. Typically, the broader the metric, the higher the variance. As such, variance in LCP is typically quite high, so for analyses where I include metrics like LCP, I typically would go for at least 20 requests for each comparison.
For analyses like this, I like to use WebPageTest, since it has a built-in feature that allows you to configure it so that it makes multiple requests for a single test, up to a maximum of 9. Since I just mentioned that I would like to go with at least 20 requests, that is still not enough though. Therefore, what I’m going to do is simply conduct multiple WebPageTest tests for each scenario and then combine the data from all of them. I already took the same approach in the analysis from my previous post, where I used 4 WebPageTest tests for each comparison to effectively get a total of 36 runs. In terms of the number of runs you go for, you can certainly argue “the more the better”, but we also have to consider the effort and potentially cost that goes into it (for example WebPageTest’s free tier only supports a limit number of runs per month). Since in this analysis I will compare two different scenarios while in my previous post analysis I only compared one, I’m going to go with a slightly lower number of runs: I will use 3 WebPageTest tests this time for each, giving me a total of 27 runs. That should still be enough to account for the typical variance in load time metrics like LCP.
Something to also keep in mind is the device aspect for how you test performance: As mentioned, performance heavily depends on the network connection and device used, so to get at least a somewhat representative idea of performance on different devices, I typically use an approach where I run each test in two versions, one in a “desktop” like configuration and the other one in a “mobile” like configuration. This is based on the approach that tools like Lighthouse and PageSpeed Insights are using. In WebPageTest, you can use a bit more granular configuration, as seen in the screenshot below.
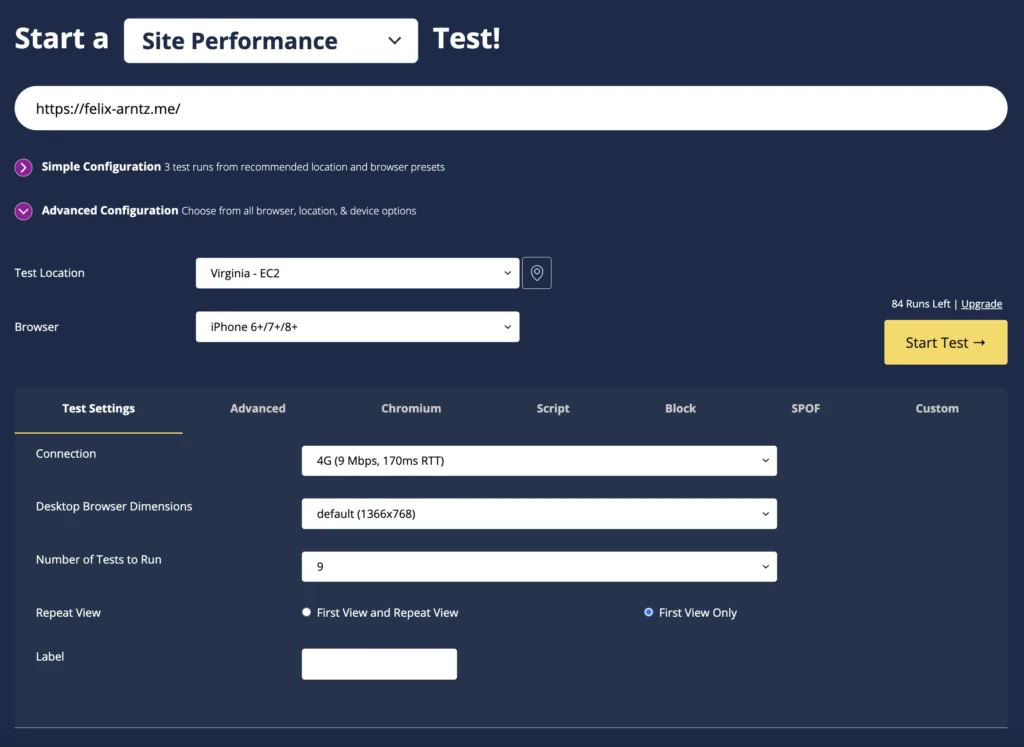
I am typically manually configuring WebPageTest using the “Advanced Configuration” view, to use a “desktop” like and “mobile” like setup. This can certainly be done in different ways, but I personally always go for the following configurations:
- For my “desktop” like configuration, I use:
- Browser: Chrome
- Connection: Cable (5/1 Mbps, 28ms RTT)
- Desktop Browser Dimensions: Default
- For my “mobile” like configuration, I use:
- Browser: iPhone 6+/7+/8+ (Chrome Device Emulation)
- Connection: 4G (9 Mbps, 170ms RTT)
- Desktop Browser Dimensions: Default
For the “Test Location” field, you can choose whatever you like, just make sure you always use the same location for all tests in an analysis. Set the “Number of Tests to Run” to 9, since as mentioned above this is the maximum supported by WebPageTest for a single test.
All in all, this means that I need 24 WebPageTest tests (2 comparisons x 2 scenarios x 2 “devices”, each of that 3 times) configured with 9 runs each, meaning this will take 216 WebPageTest runs in total. The free tier allows 300 runs per month, so if you want to replicate this analysis for your own site, you could do so without paying for additional resources.
Interpreting performance metrics from a WebPageTest result
Let’s get started! Of course you can manage your WebPageTest tests any way you like, but what I typically do is create a spreadsheet and paste the individual test URLs in there, like I did here for this analysis. I trigger the WebPageTest tests one by one, first covering all tests before the change of course. So for this analysis, I triggered the 12 “before” tests first, then deployed the WordPress 6.2 update to my live site, and then triggered the 12 “after” tests. Of course, the more tests you’re using for your analysis, the more tedious this becomes, so depending on that you may want to consider paying for WebPageTest API access so that you can automate this process. I did it manually here, which I still felt was okay for 24 tests to trigger in total.
The screenshot below shows my sheet where I pasted the WebPageTest URLs.
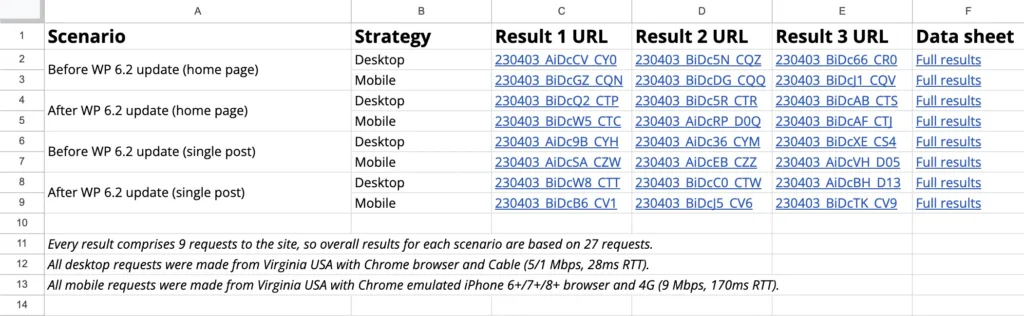
Let’s take a closer look at an individual result, for example the very first one (the one in column C2). This is what a WebPageTest result looks like. For a high level performance comparison, the main thing we are interested in is found under the “Page Performance Metrics” section that you can see when scrolling down a little. You will already see values in there for TTFB and LCP, however these may not be the correct values to look at for these metrics. I mentioned earlier that we would combine data from multiple WebPageTest test results, in order to get data from more than 9 runs. But even for this single test result which encompasses 9 runs, you need to pay particular attention to detail when you want to determine the median from the 9 included runs: The reason for that is that WebPageTest, unfortunately, always shows you data for only 1 of the 9 runs at a time in that default view. Right above these metrics, you see a small note “Based on Median Run by Speed Index” – that is the crucial bit. All of the values you see are from the run that has the median Speed Index. However, for this analysis, we don’t care about the Speed Index as a metric, so this data is not quite relevant to us. You’ll need to click on the note, and from there you can tweak which metric to use to determine the “Median Run”. Set it to “Largest Contentful Paint”, and you’ll see data for the run with the median LCP. That data now has the correct median LCP value in it.
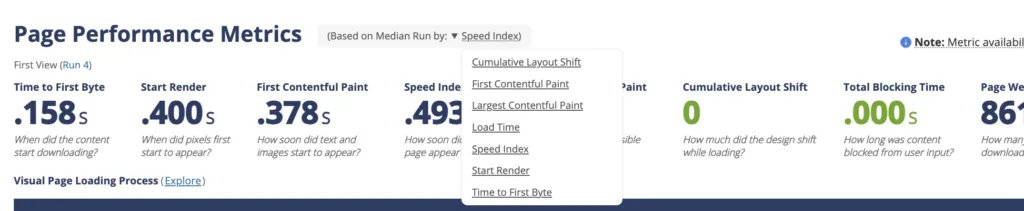
You’ll need to tweak that for every single metric that you would like medians for, for example to get the TTFB median, you’ll need to set the field to “Time to First Byte”. Sounds tedious? Indeed it is, and I wish there would be a better UI to get all medians at a glance. Even more so, since only a few specific metrics are supported by that metric dropdown field. Doing all that manually for every test result would take so much time that you’d probably want to give up on it right here. 🙃 However, don’t worry about that, since I’ll show you a way to get all the medians in a much more efficient way next.
Using a script to extract the most relevant data
As part of the WordPress Core Performance Team efforts, a few other contributors and myself have worked on an open-source CLI script that makes this extraction of medians from WebPageTest results much simpler and faster. The wpt-metrics command is available in the GoogleChromeLabs/wpp-research GitHub repository, and you can use it yourself by cloning the repository to your machine and installing the NPM dependencies via npm install.
The script supports several options, for example you can specify the metrics you would like to get medians for, whether to show only the medians or more granular percentiles, and whether you would like to get the data as a formatted CLI table or as CSV output.
Most importantly though, the script allows you to provide more than one WebPageTest result URL or ID, and if you do so, it will compute the medians from all of them. This would be an extremely cumbersome process if you had to do it yourself, as it would require going over all individual runs (in this analysis 27 runs) for every single metric and calculate the median.
Additionally, a neat feature is that you cannot only get data for regularly available metrics, but also for the sum or difference between two metrics, which unlocks the aforementioned “LCP – TTFB” data I am looking for, something that WebPageTest out of the box would not be able to provide.
Please review the documentation for the wpt-metrics command for more information.
Going back to our concrete analysis, now that we have all the individual WebPageTest URLs available, we can get the medians we’re looking for by using the script several times. Effectively, we need to run it for every single combination of “comparison” x “scenario” x “device”, so that’s 8 times. Each time we pass the 3 URLs for the WebPageTest results for this particular combination to the command so that it gets the medians from the combined 27 runs across all 3 WebPageTest results.
For example, here is the command I used for the first row in the table above:
npm run research -- wpt-metrics --test 230403_AiDcCV_CY0 230403_BiDc5N_CQZ 230403_BiDc66_CR0 --metrics TTFB FCP LCP "LCP - TTFB" "Bytes In (Fully Loaded)" --format csv --show-percentiles --include-runs --rows-as-columnsCode language: PHP (php)You can see that I individually provided the 5 metrics that I’m looking for as mentioned, and I’m also formatting the output as CSV so that I can easily import it to my spreadsheet. I have also enabled the “show-percentiles” flag to get more granular values for the 10th, 25th, 50th (median), 75th, and 90th percentile which can help assess the variance better, without having to look at all values from all runs. Last but not least, I’m using the “include-runs” option to additionally include the metrics from all runs in the output (just to include them in the sheet, which isn’t really necessary, but good for transparency and to have them permanently captured) and “rows-as-columns” option (for better formatting, since I’m also including the data for all runs, which otherwise would result in a ton of columns).
Essentially, I then ran this same command for each set of 3 WebPageTest results, with the only thing changing between each run being the WebPageTest IDs passed. I imported the output of each result into my spreadsheet, each in its own sheet, mostly to have the full data captured in the sheet.
Final results
That’s essentially it for gathering the data – almost! Now that we have the full data in the spreadsheet, of course it’s not exactly intuitive to have to navigate between those 8 sheets with the individual data and look at the few summary numbers on each sheet that actually matter. I therefore created a separate “Summary” sheet where I pulled in just the medians for every metric, in a way that is easier to parse.
This summary sheet shows pretty much everything I wanted to get out of the analysis. Here is a copy of the data, just for the “desktop” comparisons:
| Scenario | Metric | Before WP 6.2 update | After WP 6.2 update | Diff % |
|---|---|---|---|---|
| Homepage | TTFB | 150 | 149 | -0.67% |
| Homepage | FCP | 409 | 392 | -4.16% |
| Homepage | LCP | 445 | 445 | 0.00% |
| Homepage | LCP – TTFB | 295 | 290 | -1.69% |
| Homepage | Total Bytes | 881906 | 882202 | 0.03% |
| Single post | TTFB | 151 | 149 | -1.32% |
| Single post | FCP | 443 | 400 | -9.71% |
| Single post | LCP | 688 | 540 | -21.51% |
| Single post | LCP – TTFB | 532 | 391 | -26.50% |
| Single post | Total Bytes | 373202 | 373522 | 0.09% |
As you can see, server response time (TTFB) doesn’t really see a change, as expected, since my site is using a full page cache. This is not at all to discredit the amazing work that went into the WordPress 6.2 release, since in fact it includes major server-side performance improvements. However, only sites or content which are not using a full page cache will benefit from these improvements, so for my personal site specifically, these enhancements don’t play a large role. There is a minor improvement in TTFB for both scenarios, however it is just 1-2ms, which is too small to attribute it to the WordPress 6.2 release. Maybe the changes somehow make it a bit faster here, but I would honestly assume this is mostly caused by remaining variance in the metrics – which is still an important consideration when interpreting the results: Even if you’re doing many runs, there will always be variance. Therefore, if you see a difference in data that is extremely small, don’t read too much into it. There are certainly cases where the variance is still too high relatively for the small difference in comparison.
The other part of the data I would like to highlight is that indeed the fix for not lazy-loading the LCP image in block themes brings a major improvement for LCP on the single post, as anticipated. I’m still impressed honestly that it’s this much, over 20% is a notable win for a single change like that. You can see that even more pronounced when looking at the “LCP – TTFB” metric which, as outlined earlier, encompasses only client-side performance, which the aforementioned fix falls under. For the home page, of course this LCP improvement is not seen, which is since I had already implemented a manual fix for the home page prior to updating to WordPress 6.2. It is great to see however that LCP on the home page did not regress despite me having removed that temporary workaround before the 6.2 update – which again shows that the fix is working as expected on my home page too.
I hope this deep dive into how I conducted this analysis and the previous analysis has been insightful to you. I’d love to hear your experiences from measuring performance, how you’re dealing with variance in performance metrics etc. Also, if you’re interested in conducting a similar analysis for another website, please feel free to use the approach and CLI script I shared here – I’d love to see more of this kind of analysis publicized, where feasible. Last but not least, please let me know if you have any questions or feedback in the comments. A lot of this is based on gathering more experience in performance measurement over the past year, and I’m always eager to learn more about it.
Leave a Reply